While exploring blog posts on
Kaggle, I came across an open source data visualization tool that I thought was really neat, called
Gephi. It is described as "Photoshop but for data." I decided to try out this program with my own Facebook network. After looking at the Gephi tutorials page, I found the Facebook app called
Netvizz that allows you to download a copy of your Facebook network in a GDF or TAB file.
After downloading the files, I opened the .gdf file in Gephi. After opening the file, an Import Report screen comes up (Fig. 1). I selected the graph type to be undirected, which means that if A connects to B, then B also connects to A, which is how a Facebook network would work. If I chose a directed graph, then that means that A connects to B, but B might not be connected to A.
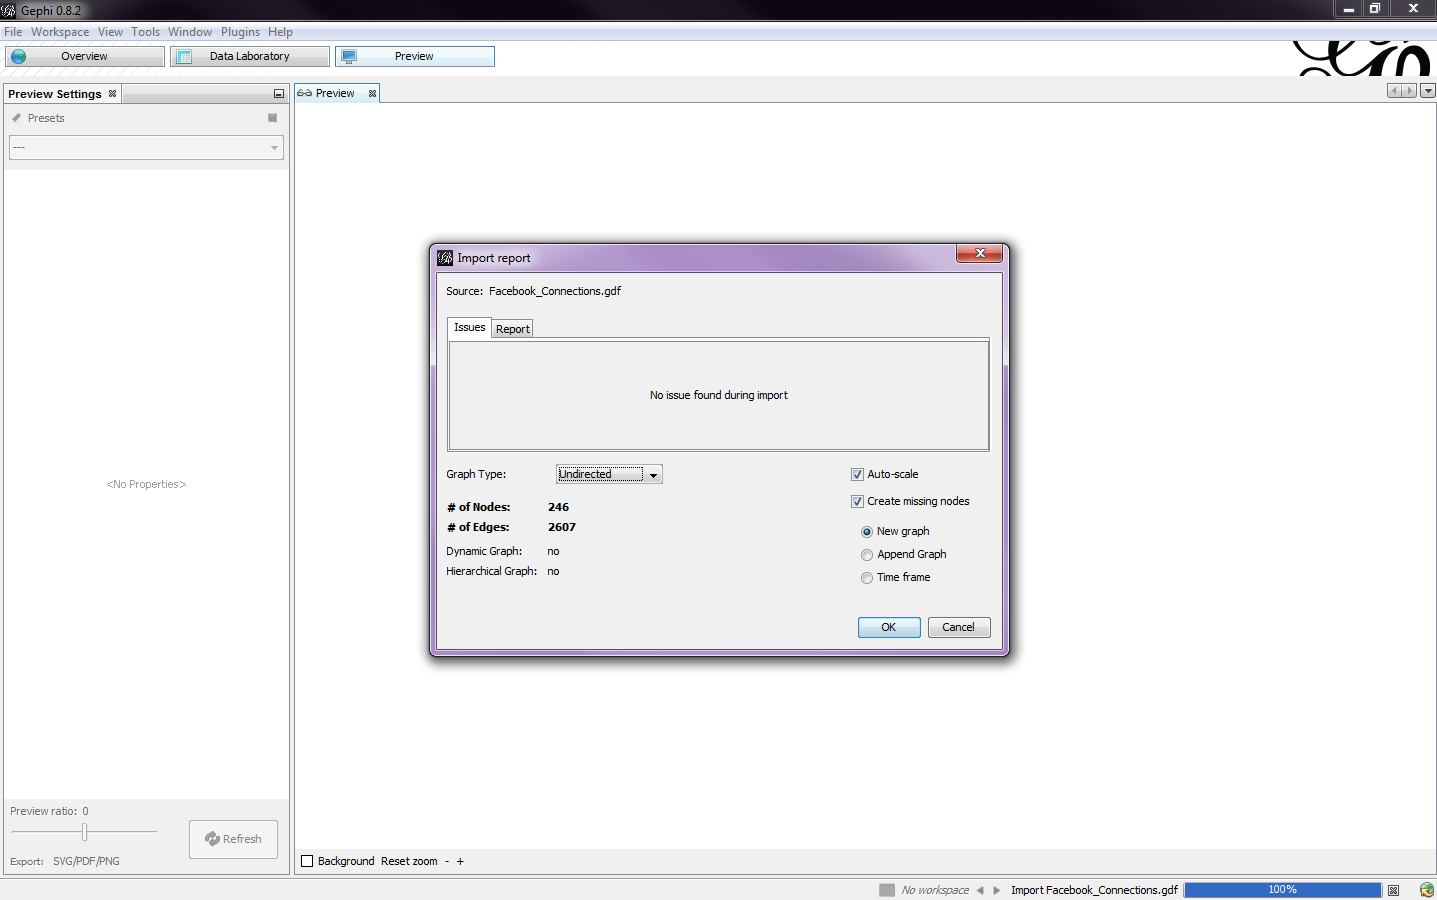 |
| Fig. 1 |
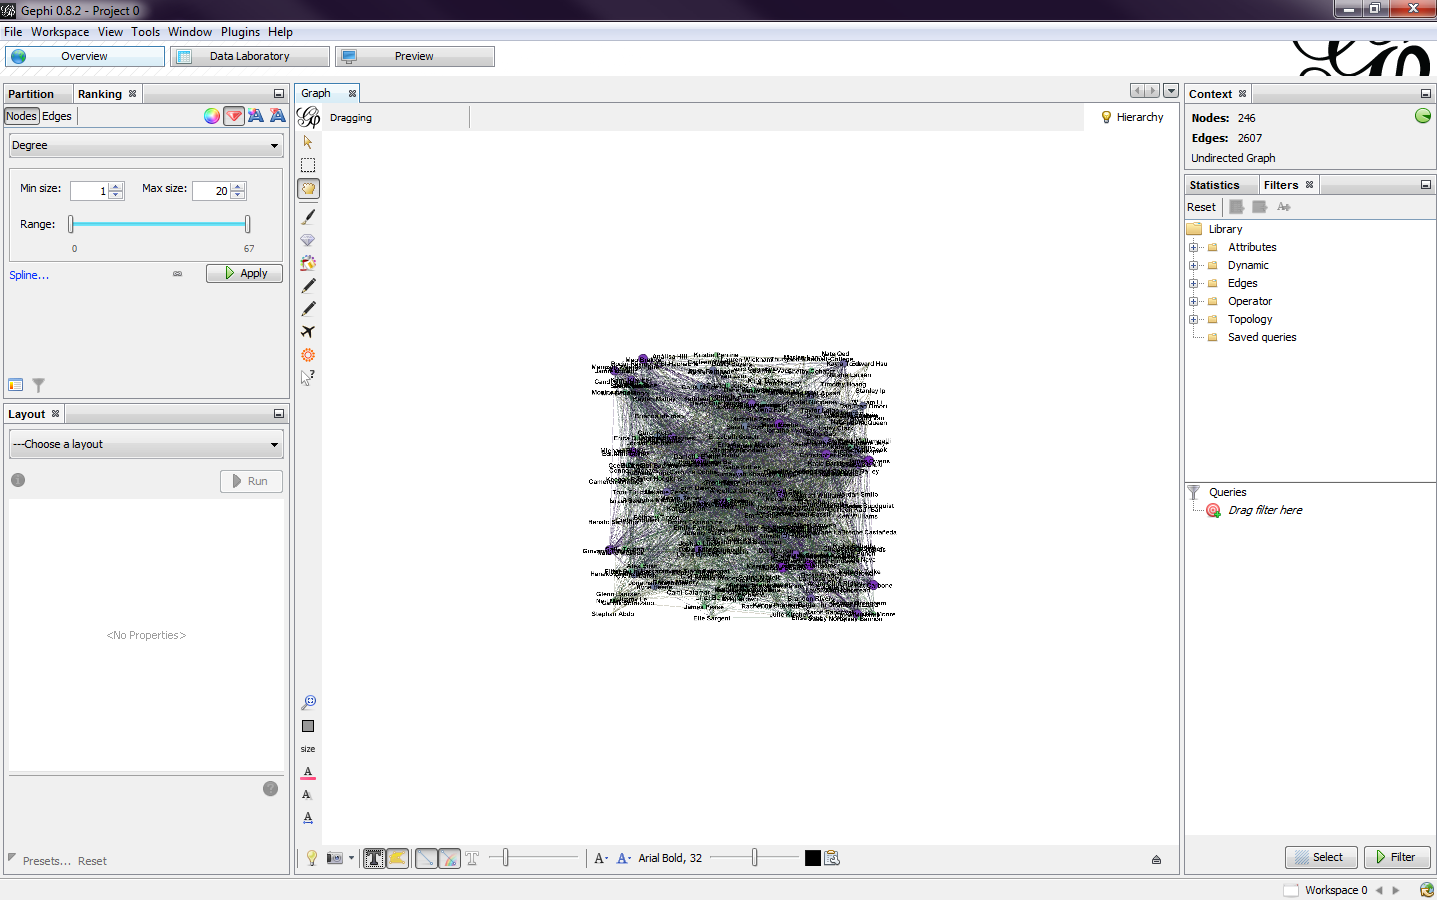
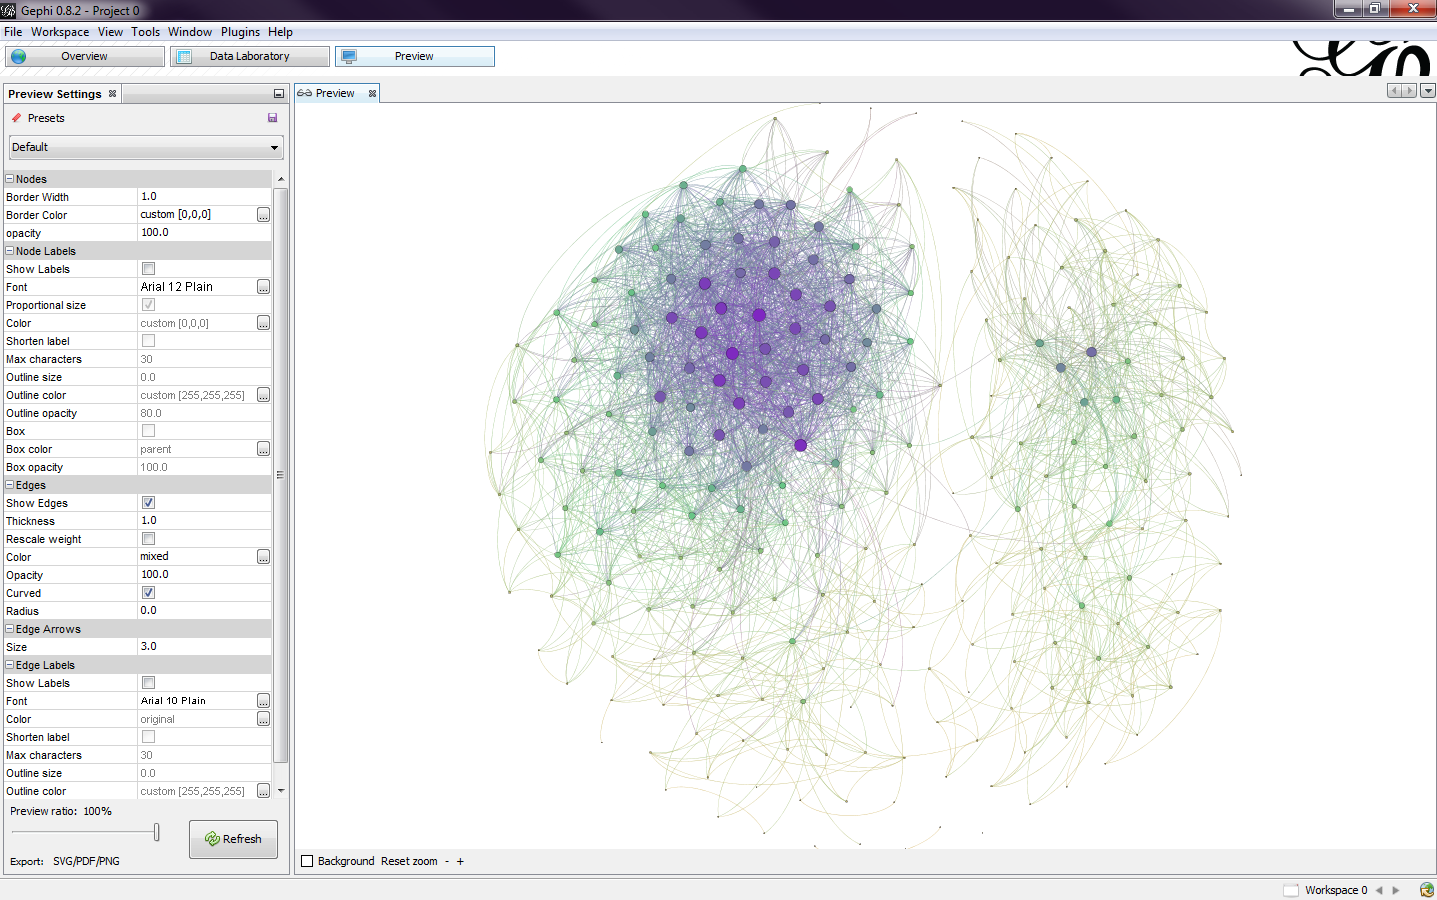
After selecting ok, the data was imported and I got a preview of my network (Fig. 2). Each circle, or node, represents a person and the lines, or edges, shows the connections between them. You can zoom in and out by using the scroll wheel on the mouse and you can pan left or right by using the right mouse button and dragging along the screen. If you lose view of the graph, you can press the magnifying glass on the left bottom toolbar to center the graph in the window.
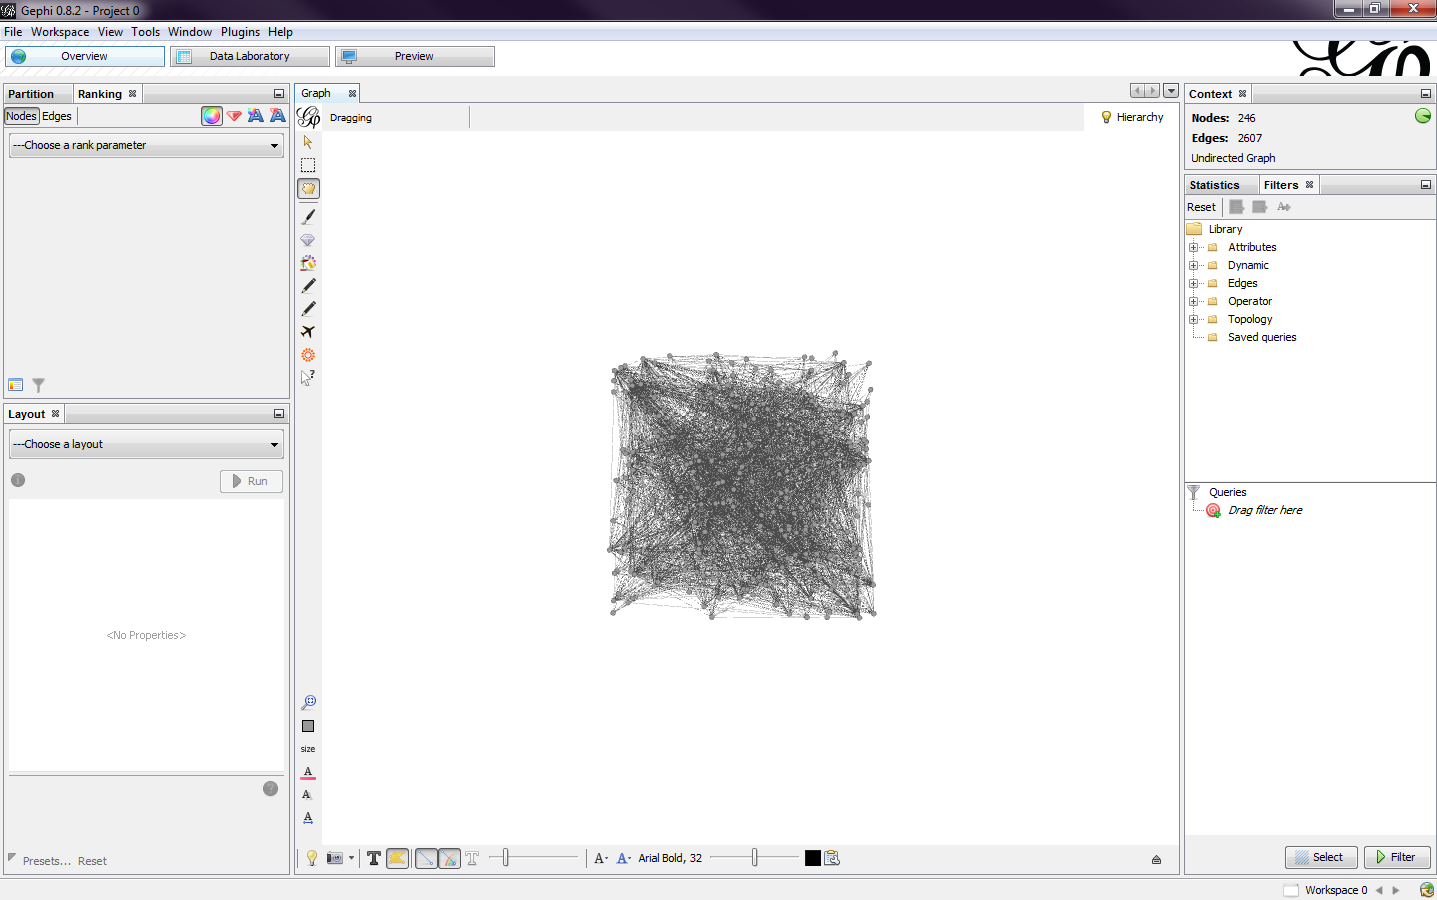 |
| Fig. 2 |
In the ranking window in the top left is where the color and sizes of the nodes can be adjusted. By selecting the degree option, I first changed the color scheme (Fig. 3). I created my own by hovering over the color bar and clicking the triangles to pick a color. There is also an option to pick a default color scheme and to invert the chosen color scheme. Next, I adjusted the sizes of the nodes (Fig.4). I set my minimum node size to 1 and the maximum to 10.
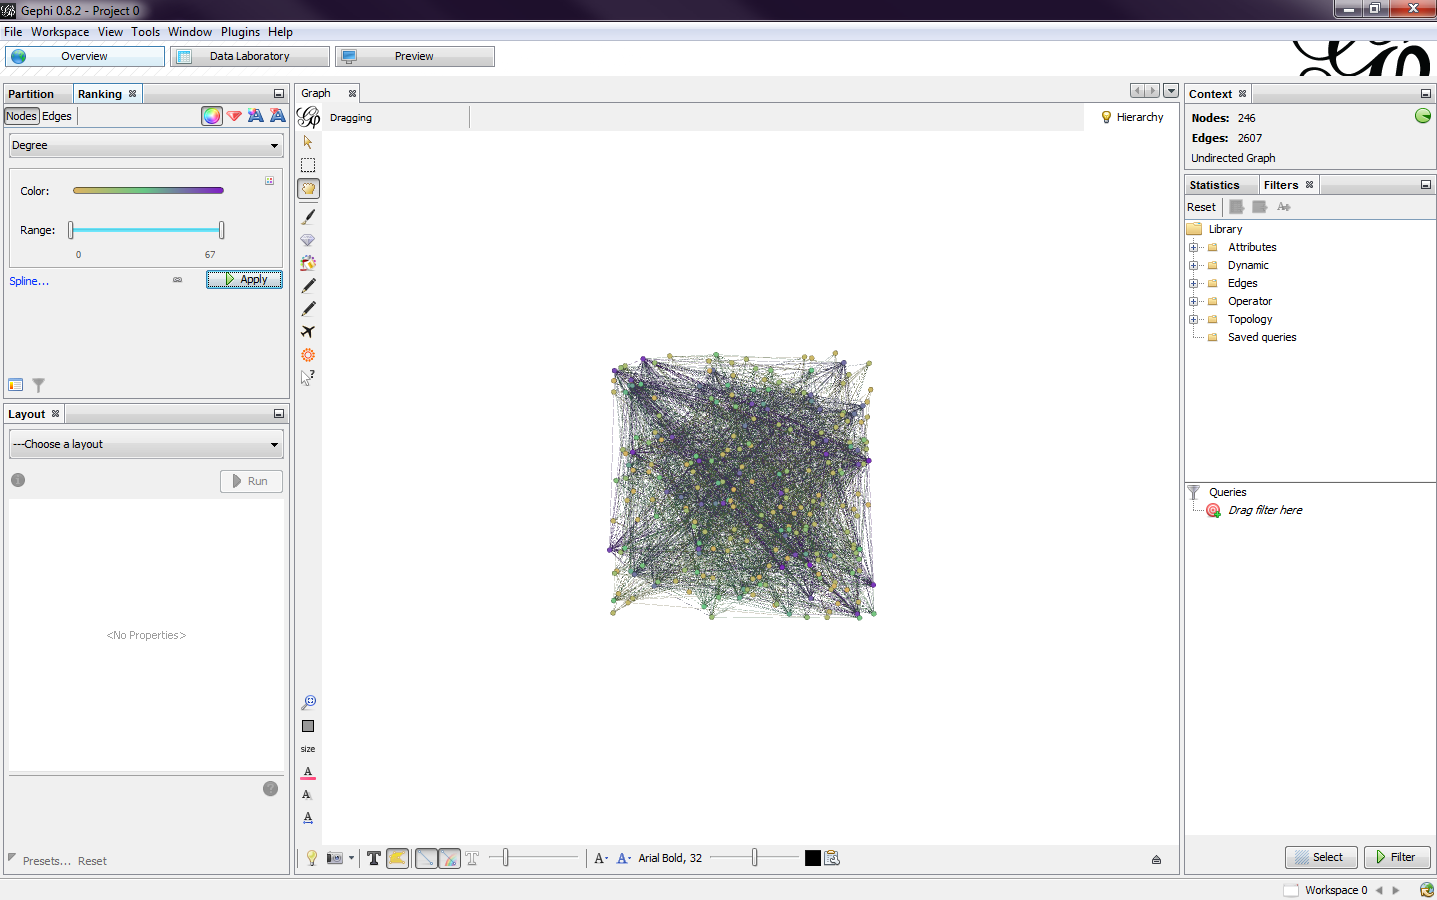 |
| Fig. 3 |
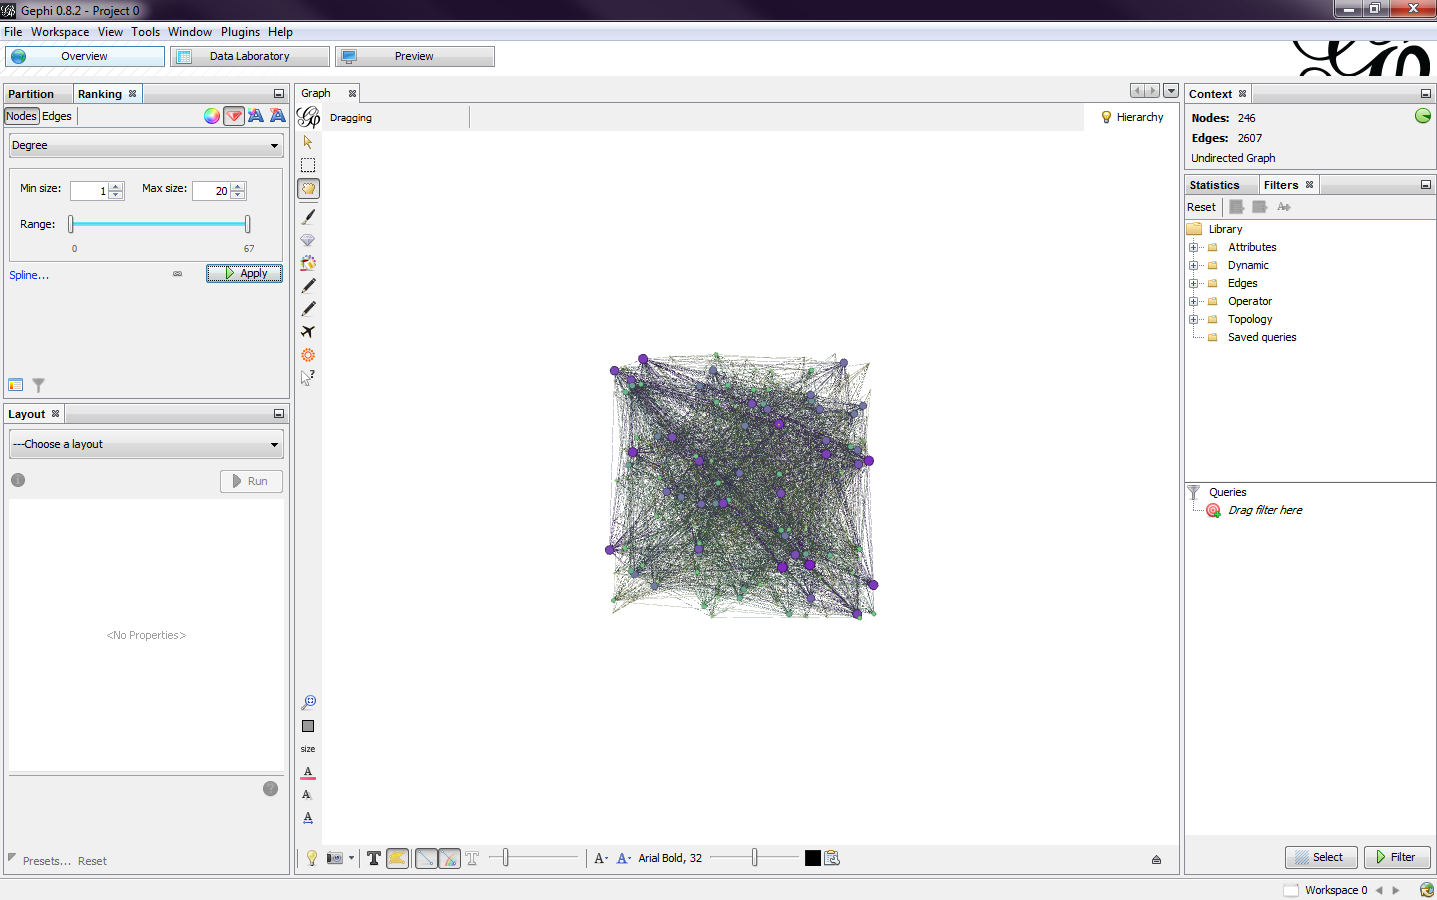 |
| Fig. 4 |
You are also able to add labels to the nodes (Fig. 5). By clicking the T button on the bottom toolbar will toggle the labels. The size of the text and the position and color can also be adjusted. I decided to have the labels turned off because it got too cluttered.
 |
| Fig. 5 |
Next, I chose a layout algorithm for the data (Fig. 6). This will set the shape of the graph. I chose Fruchterman Reingold for this particular graph (Fig. 7). I left the layout properties unchanged and ran the algorithm. Once it was finished, I got a more aesthetically pleasing graph than the giant square I started with (Fig. 8).
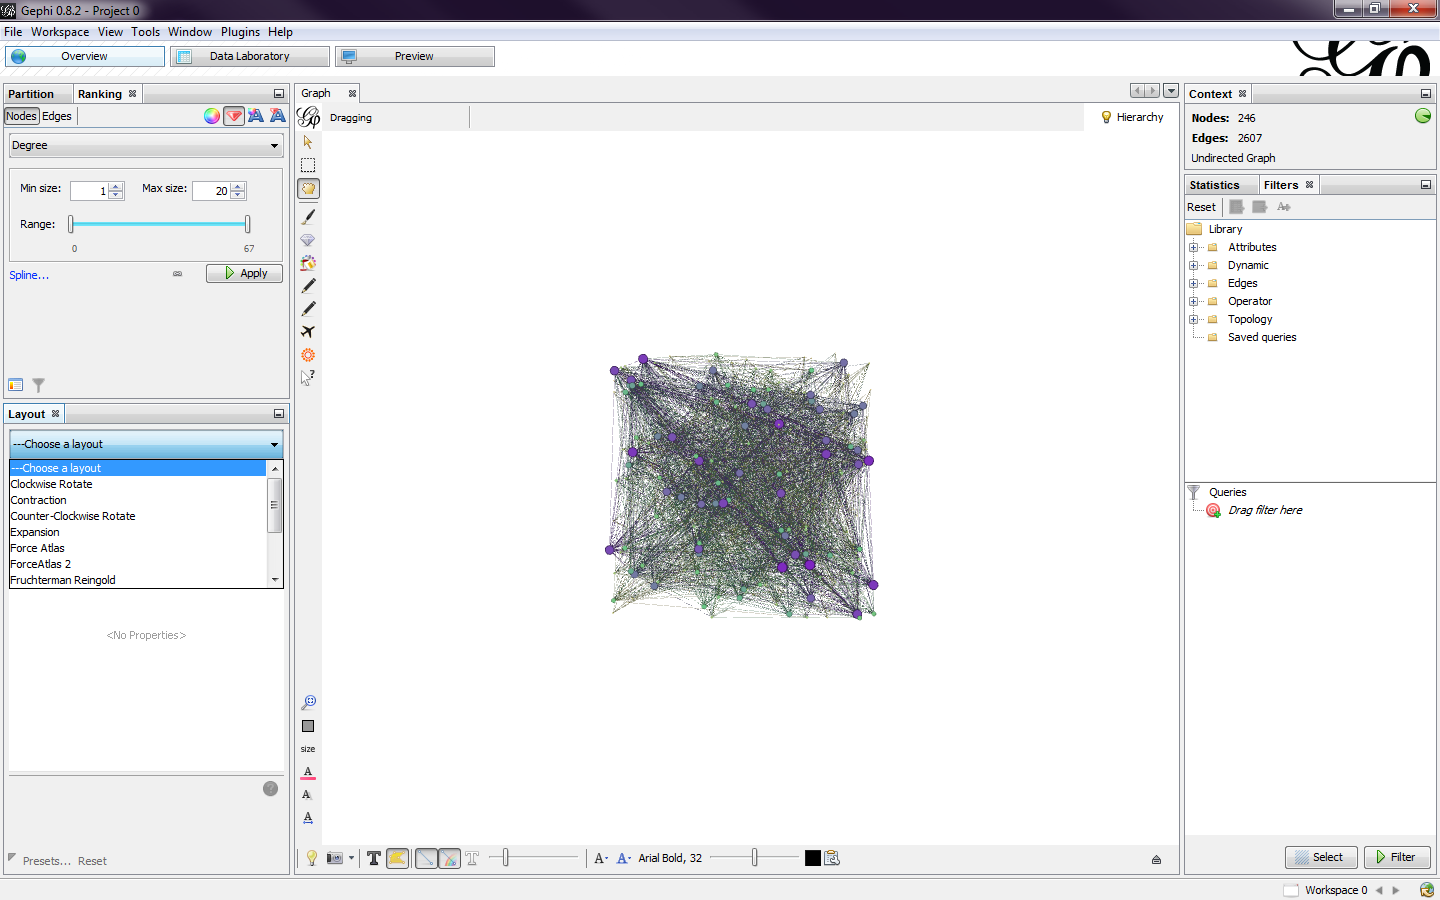 |
| Fig. 6 |
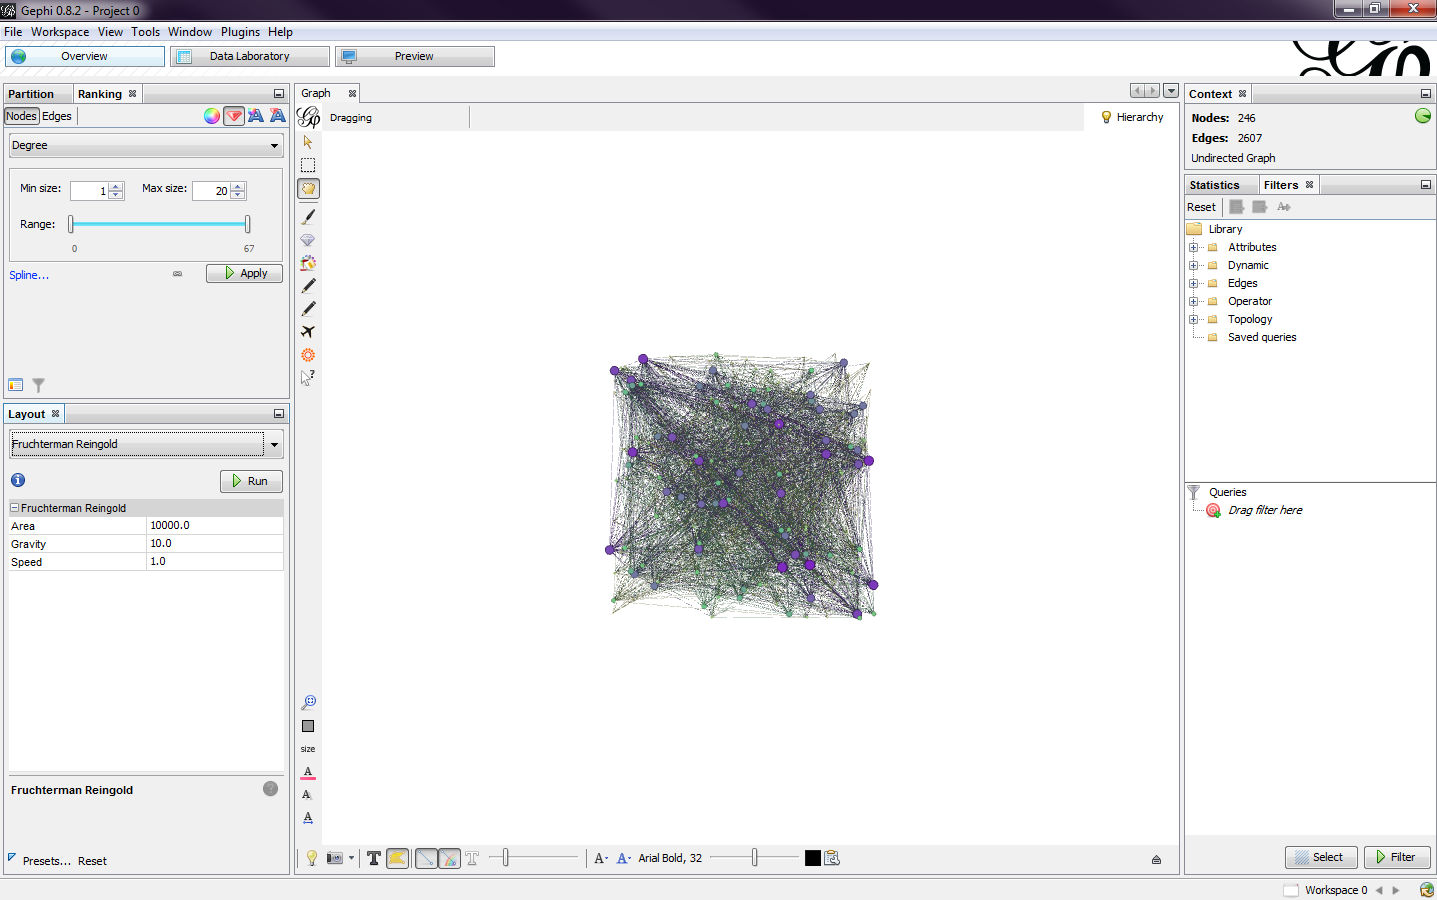 |
| Fig. 7 |
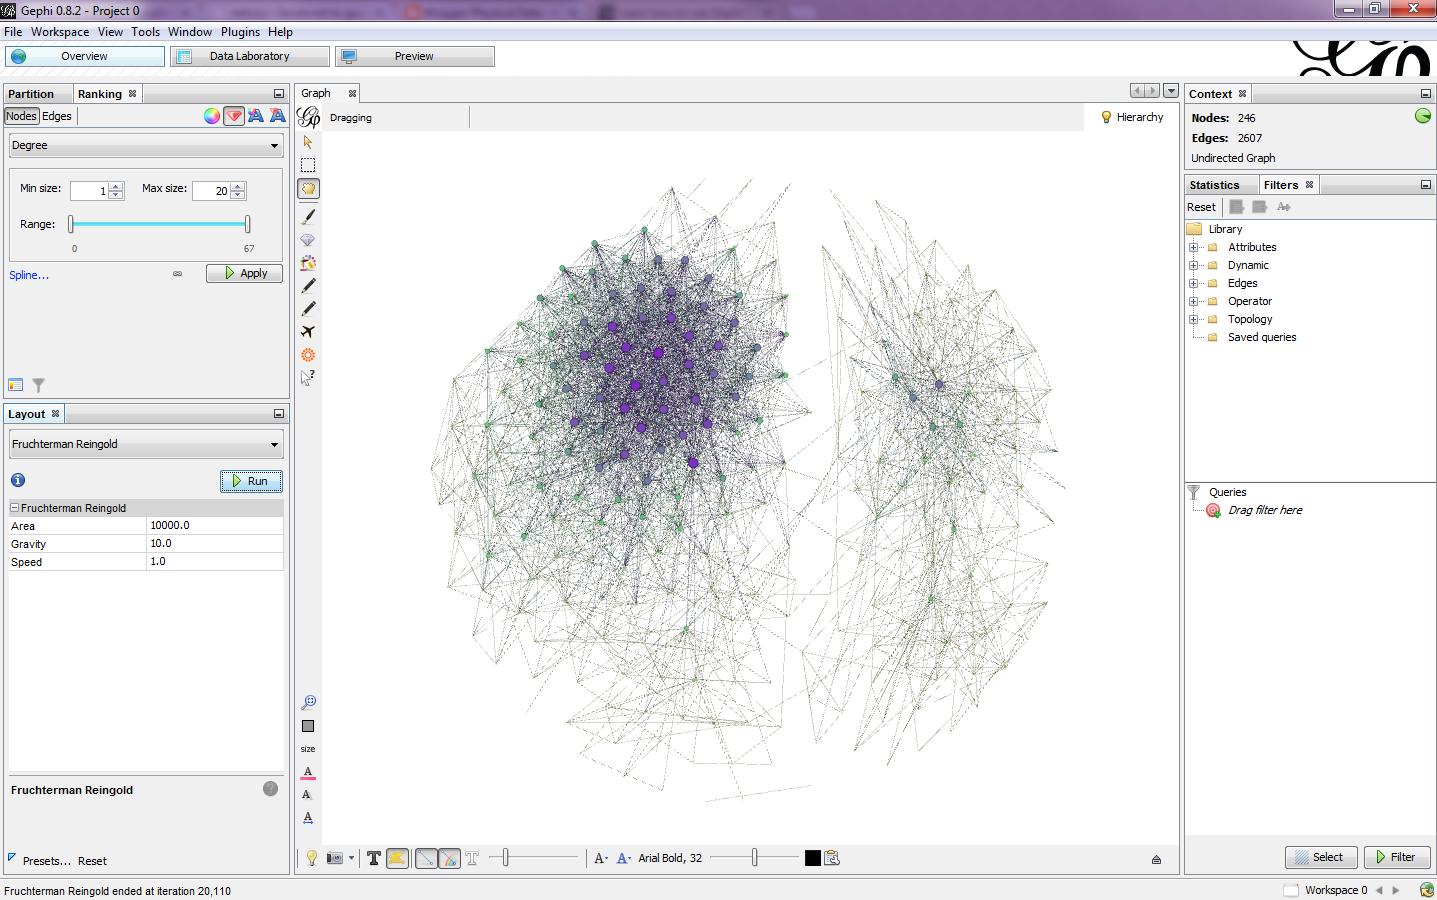 |
| Fig. 8 |
Being pleased with the output, I went to the preview window to see the complete rendered version of the graph (Fig. 9). I set the edges to be curved to get a nice looking output. I then exported the final result. There are three options: SVG, PDF, or PNG. I exported to a PNG and got the final graph (Fig.10).
 |
| Fig. 9 |
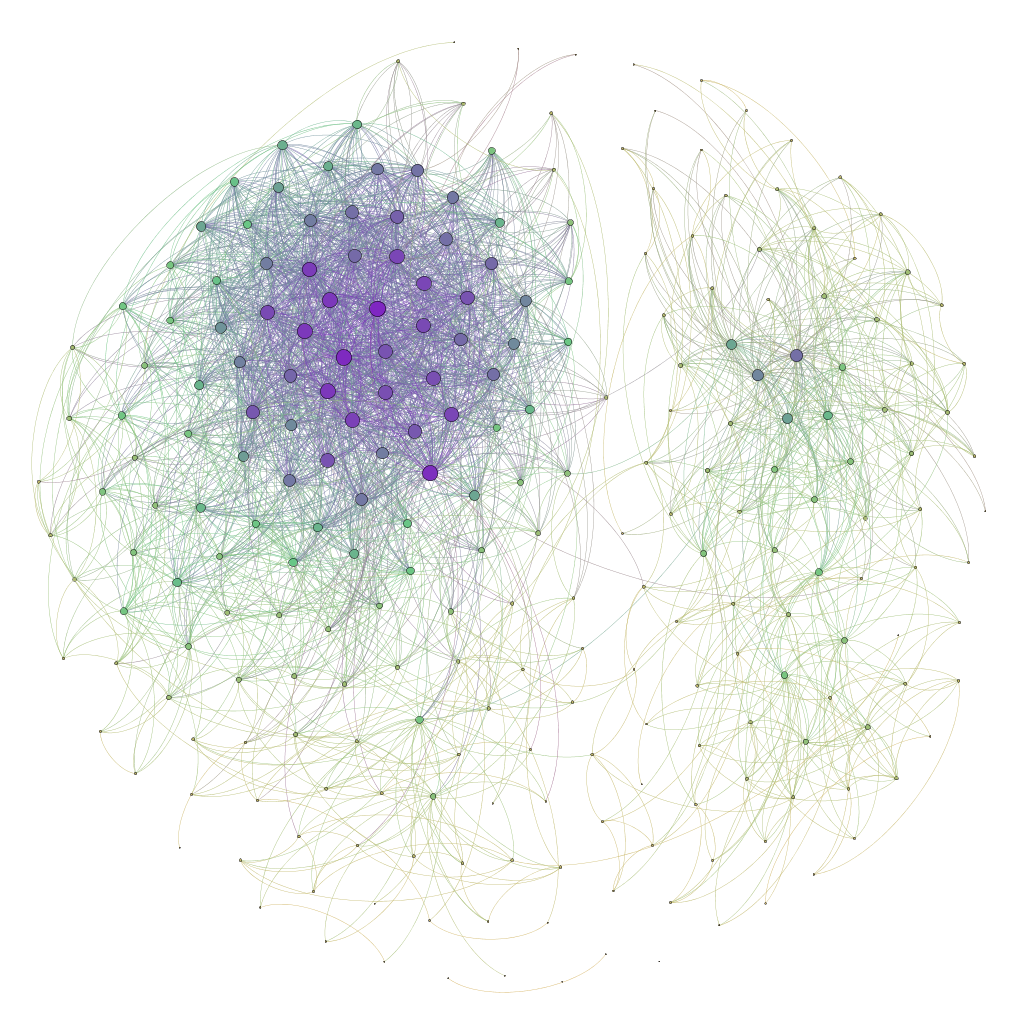 |
| Fig. 10 |
Analyzing the graph, I noticed a pattern. The big super cluster on the left are people I went to high school with, while the smaller cluster on the right are people from my university. There's a few people in the middle that share connections with both groups.
I then played with the data set a little more and explored different layout algorithms, filters, and color schemes. I ran the Forced Atlas layout and got a graph that further divides my data into more clusters (Fig. 11). I noticed five clusters, each one representing a different group of my connections. Blue represents high school, dark green represents my family, yellow represent my junior college, red represent the group of friends I spend the most time with, and the light green on the left represents my university.
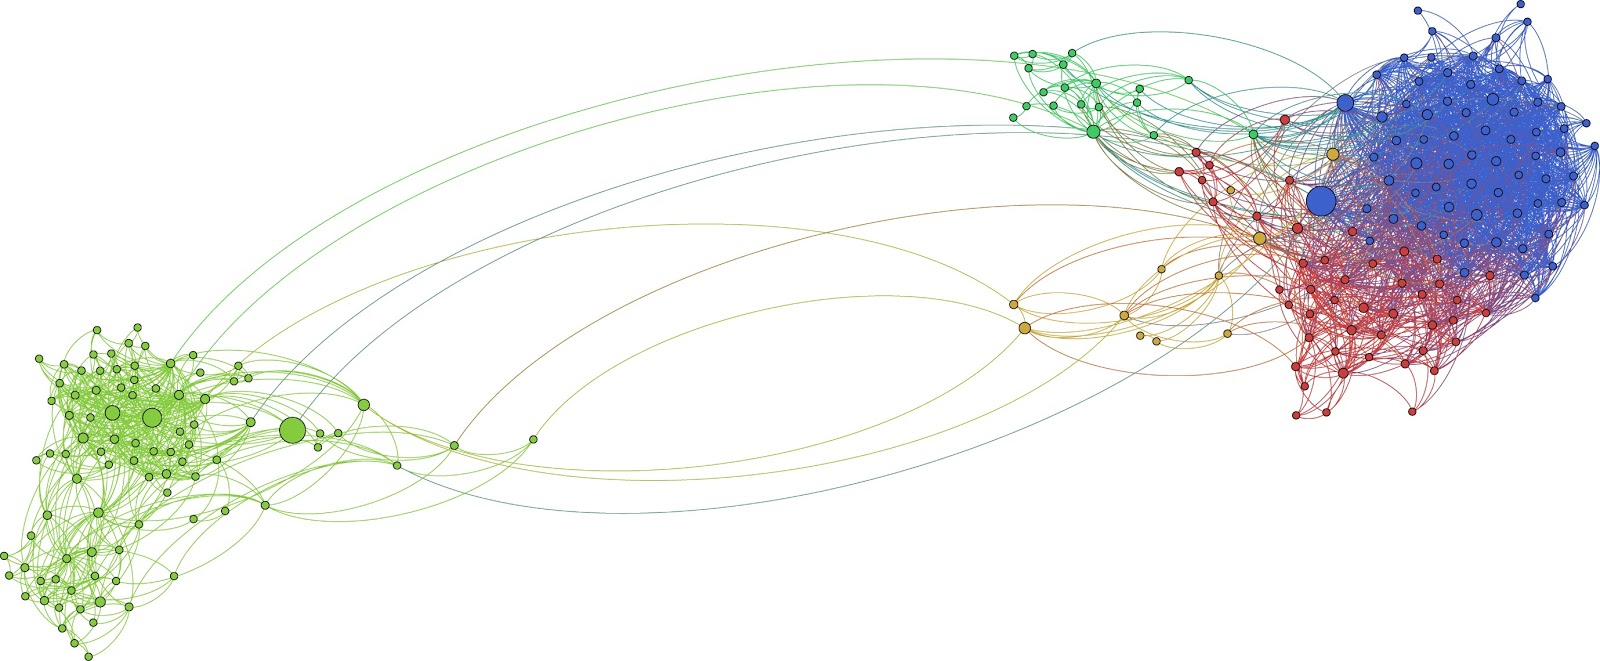 |
| Fig. 11 |
This tool was a great find and I know that once I explore more of its features, I will be able to graphically represent data sets to find important trends and patterns that I wouldn't have been able to see through other programs and data filtering techniques.
